
WebGUI
Contents
- 1 Getting Started with the Silicon Radar WebGUI
- 1.1 WebGUI and Com2WebSocket connection
- 1.2 Understanding the User Interface.
- 1.3 Using the Control Panel (Sensor Settings)
- 1.3.1 Communication Options (COM Tab)
- 1.3.2 Load and Save Settings (Presets Tab)
- 1.3.3 System Configuration Tab
- 1.3.4 Output Data Tab
- 1.3.5 RF Parameters Tab
- 1.3.6 BB Processing Tab
- 1.3.7 Target Recognition Tab
- 1.3.8 Scene Control Options (Scene Controls Tab)
- 1.3.9 Radar Hardware Information (System Info)
- 1.3.10 Recently Sent Control Frames (Log)
- 2 Using the Main Menu
- 3 WebGUI 1.2.4
- 4 WebGUI 1.4
- 5 WebGUI Easy r4
1 Getting Started with the Silicon Radar WebGUI
1.1 WebGUI and Com2WebSocket connection
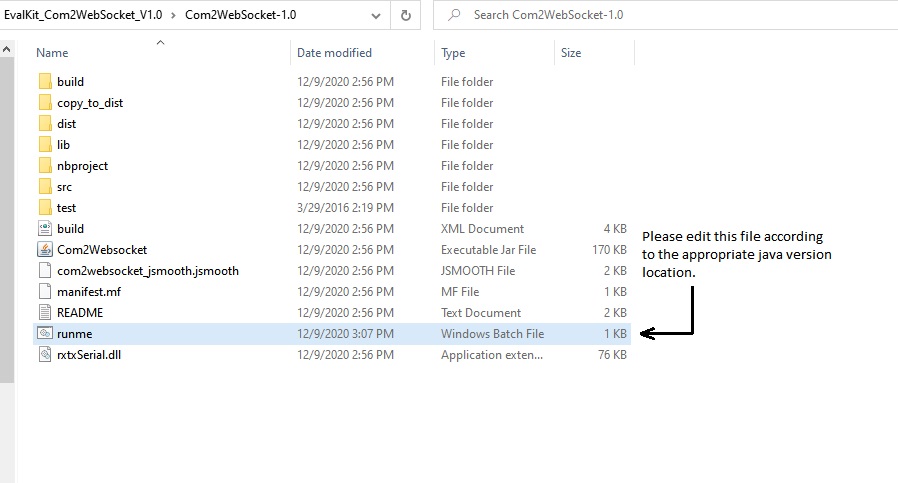
The Evaluation Kit software contains a COM2WebSocket tool that creates a WebSocket from the virtual COM port to provide it to the graphical user interface. You can find the tool in the Install Package in the ‘Software’ folder from the Silicon Radar webpage [1]. The COM2WebSocket tool is portable and can be copied to a path of your choice on your PC. Follow the instruction in Figure 1 if necessary.
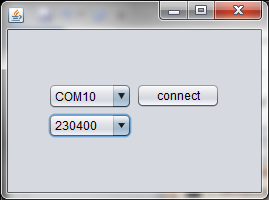
In the COM2WebSocket application window, select the virtual COM port number that belongs to your sensor board and select 1M baud for firmware 1.4 and higher or 230400 baud for lower firmware version as the baud rate like shown in Figure. A click on the ‘connect’ button opens a WebSocket server, which is fed with the data coming from the sensor board.
1.2 Understanding the User Interface.
For detailed explanation please see WebGUI Guide
The SiRad Evaluation Kit is developed to demonstrate the functionality of Silicon Radar’s transceiver chips as millimeter-wave distance and velocity sensor front end s. Once the WebGUI is launched, the main window is displayed like shown on the right.
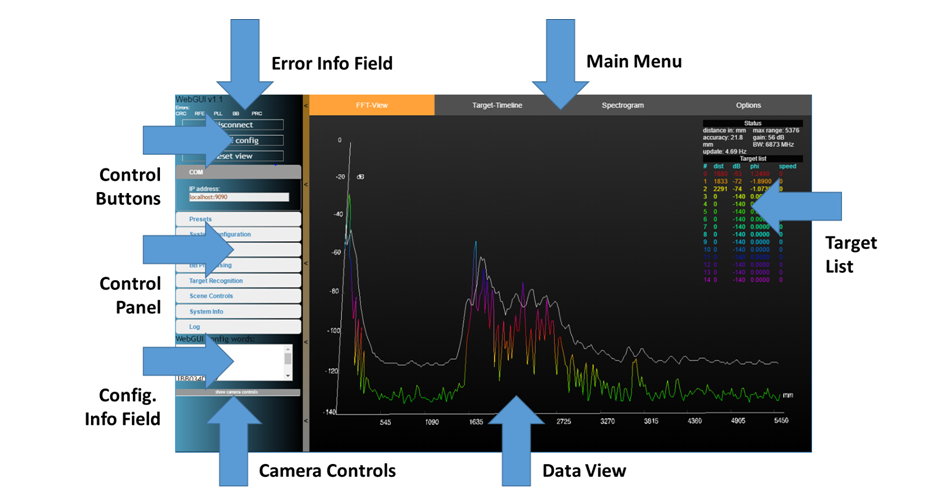
The Silicon Radar WebGUI consists of four main panels:
- control panel on the left side,
- main menu on the top of the screen with the active view in orange,
- scene/canvas itself where the sensor data is displayed,
- target list with the status fields on the right side of the screen (draggable).
The control buttons on the top left corner are used to connect the WebGUI to the SiRad Evaluation Kit.
Connect: used to connect the WebGUI to the WebSocket provided by the Com2WebSocket tool, which should be started before connecting the WebGUI.
Resend config: used to send the current settings to the SiRad Easy®. Usually, the settings made in the WebGUI will immediately take effect on the SiRad Evaluation Kit, however, this feature is useful when a SiRad Evaluation Kit was reset or reconnected.
Reset view : resets the view area to use the maximally available window space for displaying the data and centers the view in the view area.
1.3 Using the Control Panel (Sensor Settings)
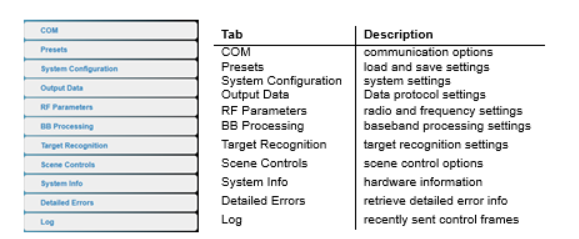
The control panel on the left side of the WebGUI provides the controls for the user interface. It is used to connect to the Evaluation Kit, to send commands, and to change the data view. The control panel contains the sections shown in the figure below.
1.3.1 Communication Options (COM Tab)
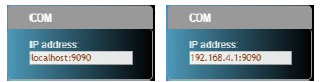
The standard-setting ‘localhost: is for communication via the USB port, see the figure below. If you are using WiFi, type in the IP address and the port 9090 of the SiRad Easy® ’s WiFi module like in Figure (below), for example, 192.168.4.1:9090.
1.3.2 Load and Save Settings (Presets Tab)
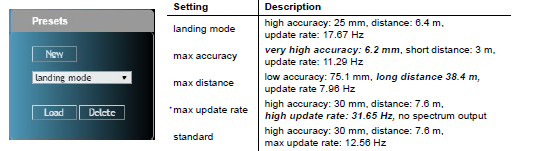
Load predefined settings: You can load predefined settings via the dropdown box in the ‘Presets tab, see Figure (left). Choose a setting and press ‘Load’. Afterward, go to the ‘ System Configuration’ tab and choose ‘SER 2 if you use the USB connection instead of WiFi The factory presets are explained in the figure below.
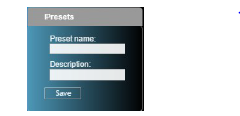
Save own settings: To save your settings, click the ‘New’ button. The dialog in the Figure below appears. Enter a preset name and description for your settings and click ‘Save ’’. All settings are stored as cookies in your browser so that they are available next time when you open the browser. Please make sure that your browser saves and keeps cookies (Mozilla Firefox) or local storage is enabled (Chrome Browser) to enable this feature. Do not use a ‘ private mode and do not set up your browser to delete all saved content each time you close the window.
Delete settings: To delete settings, choose a preset name and click ‘Delete’. In case you accidentally delete one of the factory presets, those will be automatically restored next time you open the browser.
1.3.3 System Configuration Tab
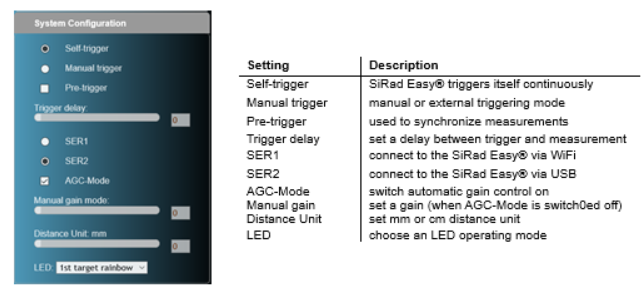
The ‘System Configuration’ tab shown in the figure below is used to control system related settings of the SiRad Evaluation Kits such as gain, triggering mode, and LED.
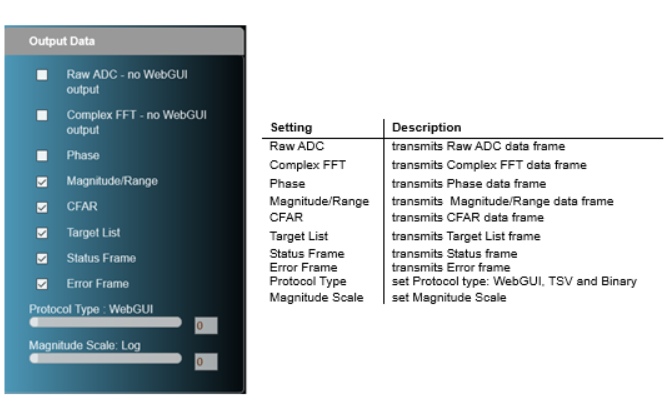
1.3.4 Output Data Tab
The ‘Output Data’ tab is used to set the transmitted output data type and data communication protocol. Output Data section can be used to activate Raw ADC and Complex FFT, however, these frames demonstrations are not supported by WebGUI.
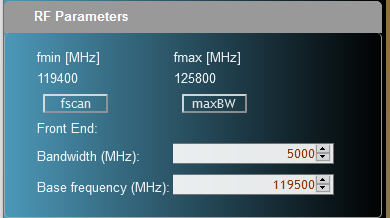
1.3.5 RF Parameters Tab
The ‘RF tab’ is used to control the radar front end of the Evaluation Kit. For each radar measurement, the front end is driven with one or more frequency ramps starting from a defined start frequency f1 (base frequency) to a higher frequency f2 with the bandwidth BW = f2 - f1. The higher the bandwidth, the smaller is the detection range of the SiRad Easy® due to Nyquist limitations. The start frequency is technically limited by the minimum frequency f min supported by the front end. The bandwidth is limited by the maximum frequency f max supported by the front end. Please note, that in most countries, the permitted bandwidth is regulated by law to 250 MHz between 24 GHz and 24.25 GHz and to 1 GHz between 122 GHz and 123 GHz for field applications. Please check your local regulations.
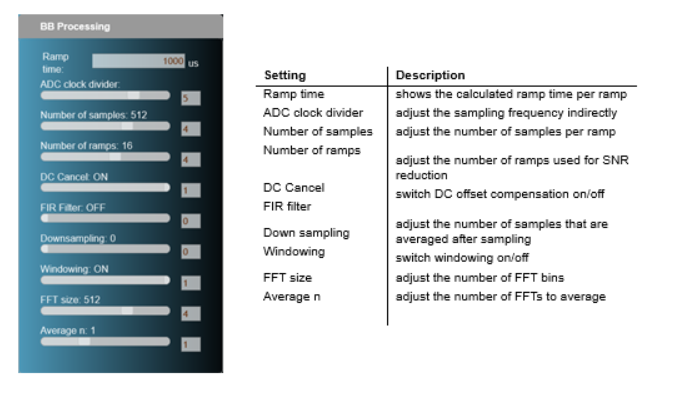
1.3.6 BB Processing Tab
The ‘BB tab shown’ in Figure left is used to control the baseband processing of the SiRad Evaluation Kit to tune the SNR, accuracy, or processing speed.
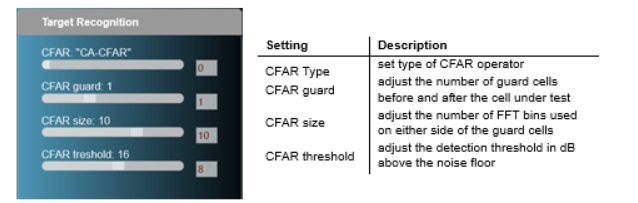
1.3.7 Target Recognition Tab
The ‘Target Recognition’ tab is used to control the CFAR operator for the target recognition. The CFAR operator is explained below sections. We use a simple CACFAR operator that calculates the average from the reference cells for the CFAR.
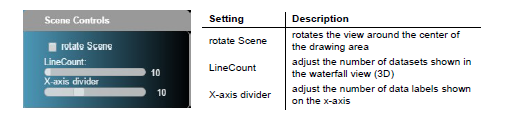
1.3.8 Scene Control Options (Scene Controls Tab)
You can control the scene with the settings shown on the ‘Scene Control’ tab shown on left
1.3.9 Radar Hardware Information (System Info)
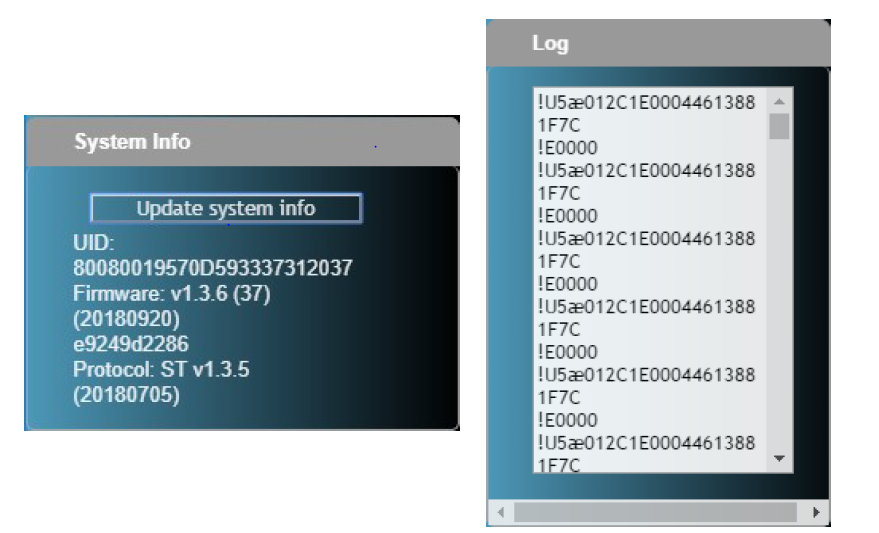
The System Info tab shows the unique hardware identification number of the SiRad Evaluation Kit, the firmware version, date of compilation, version identifier, and protocol version and specification date. You can press the ‘Update system info’ button to refresh this information from the sensor.
1.3.10 Recently Sent Control Frames (Log)
The Log tab lists (top, right figure) the latest control frames sent to the SiRad Evaluation Kit. Also, see the Protocol Description for further information about the SiRad Evaluation Kit communication protocol.
2 Using the Main Menu
Here you can select how the data should be displayed. You have the following main options, which are explained in the following subsections

- FFT View: FFT (2D) and Water fall (3D)
- Target Timeline
- Spectrogram
- Options
FFT View
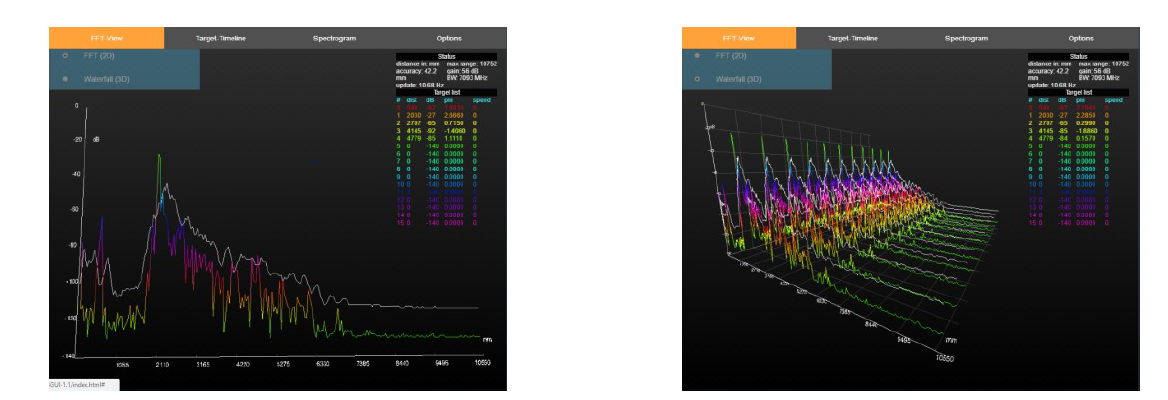
- FFT (2D ) chart: The x-axis shows the distance and the y axis shows the magnitude in dB at this distance.
- Waterfall (3D ) chart: In the 3D view you can see the history of data, with the z-axis being the timeline. Older values move to the back (higher z values). The x and y axes behave like in the 2D view.
Status Field and Target List
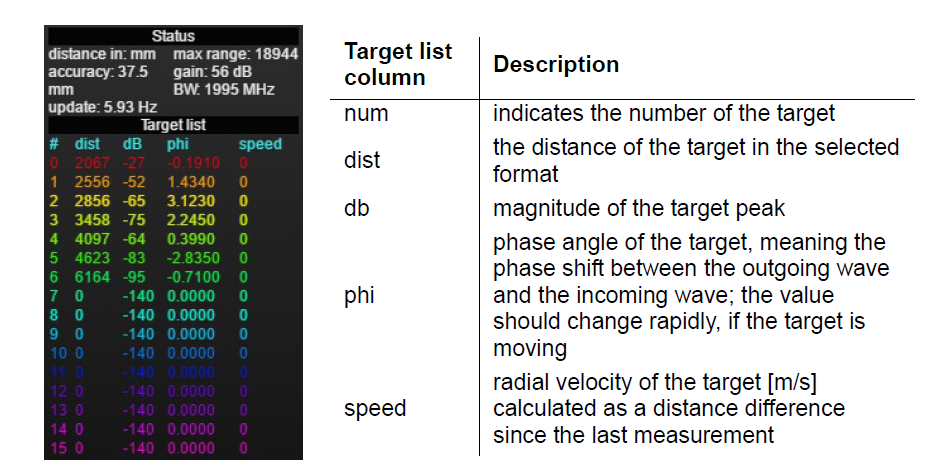
The ‘Status’ field displays a couple of useful information about the current measurements.
- distance: shows the used distance format of the SiRad Easy®, for example, [mm, cm, bins].
- max range: current max. measurement range of the SiRad Easy® in the chosen distance format.
- accuracy: the width of one distance bin of the SiRad Easy® after the formula acc = c * nSmp / (2 * BW * n FFT * 2 ndown, where c is the speed of light, BW is the bandwidth, nSmp is the number of samples, nFFT is the FFT size, and n down is the downsampling factor.
- gain: the current gain setting of the baseband amplifier in dB.
- BW: the chirp’s bandwidth.
- update: calculated update rate from the TSLM value („time since the last measurement“).
The ‘Target list, is ordered by distance. With every new measurement having the CFAR operator enabled, the ‘Target list is updated. Where the distance bin crosses the CFAR threshold from below, the local maximum is searched and a target is generated. If two or more target peaks cross the CFAR threshold from below before the distance bin goes back underneath the CFAR threshold, only the first target is marked.
Target Timeline
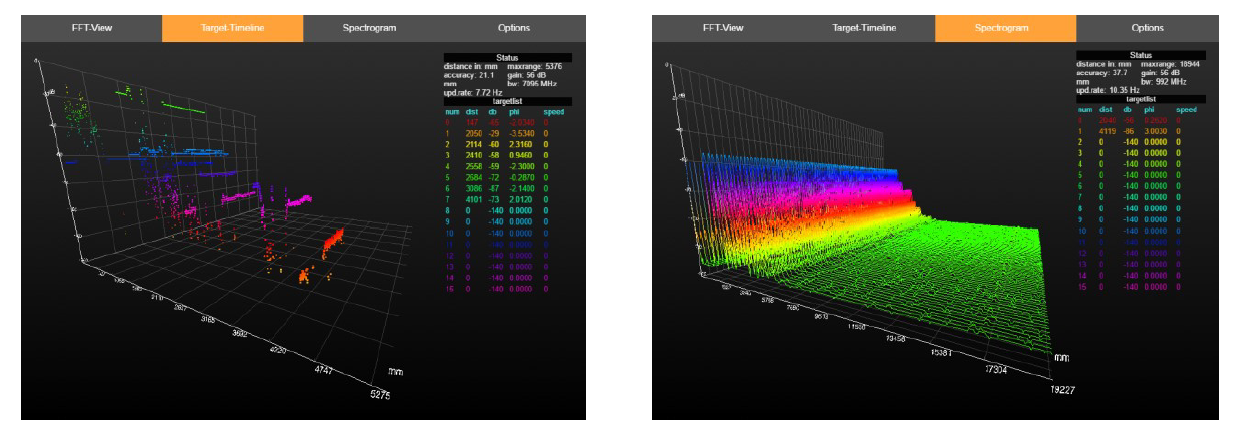
The ‘Target Timeline’ shows the magnitudes of past targets. The x-axis shows the distances of the targets and the y axis shows the magnitudes of the targets in dB. The z-axis shows the timeline of the data. Older values move to the back (higher z values).
Spectrogram
The ‘Spectrogram ’is another time-dependent display of distance data.
Options
In the ‘Options’ menu, you can choose the coloring of the data between:
- Magnitude
- Range/target number
- Phase angles ( the phase angles are only colorized if the magnitude is larger than 120 dB and when the Phase frame transmission is enabled in the ‘System Configuration’ Tab)
- No coloring
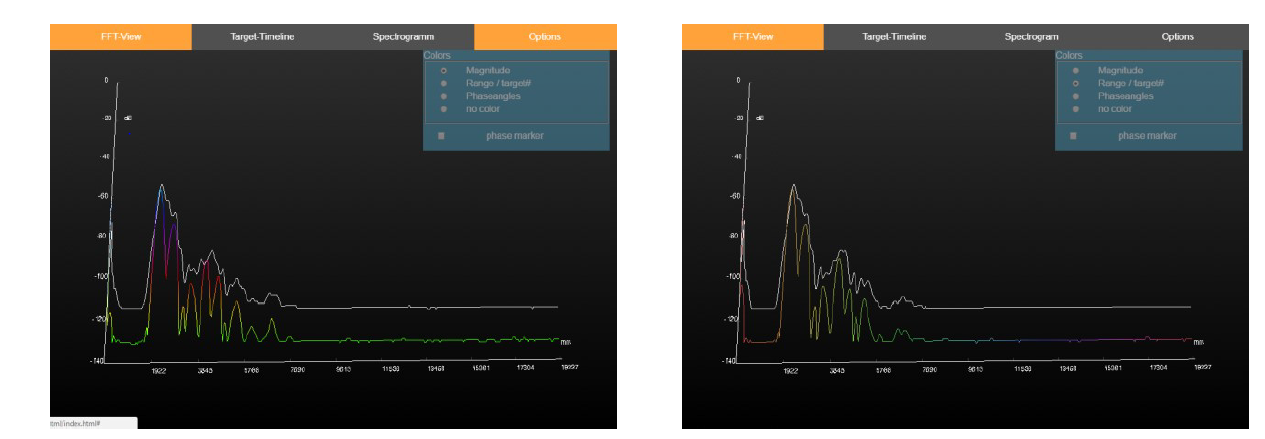
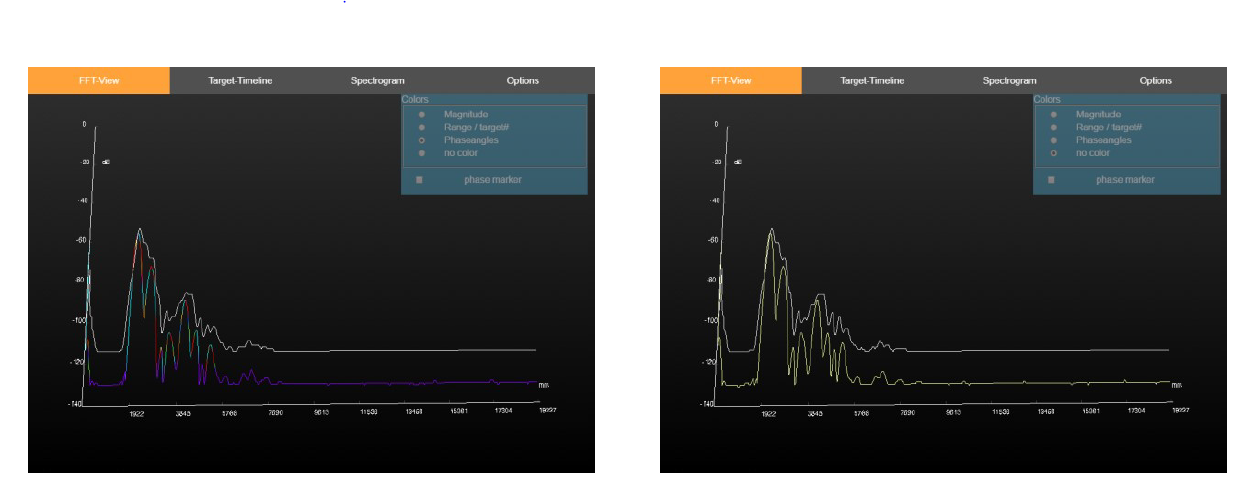
There is also an additional option to display phase markers above the detected targets. These markers show the phase angle of the detected target. The phase angle is very sensitive to slight changes in the target distance within one distance bin. It can be used to display relative motion in the µm range.
2.1 Understanding the Configuration Info Field
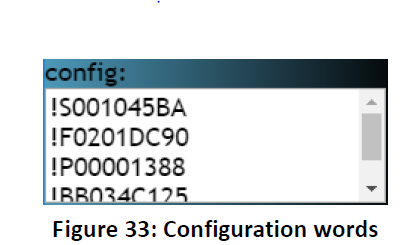
The config field shows the configuration that was sent by the WebGUI to the SiRad Evaluation Kit on connect. Those config words are further explained in the protocol description.
2.2 Camera Controls
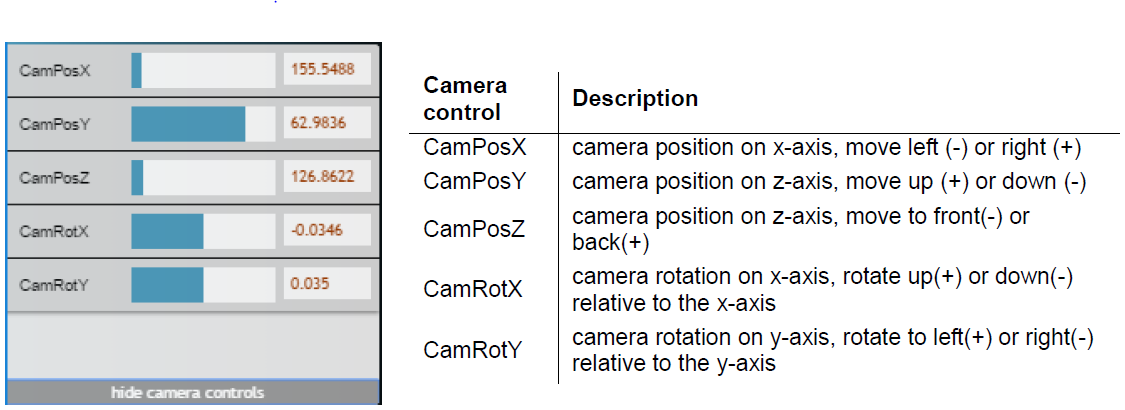
Click on the bar in the bottom left to show the camera controls. Here you can see and change the camera position and rotation of the view relative to the specified axis. The camera view can be changed using the mouse within the scene area. A left-click drag pans the camera position. A right click-drag changes the camera view angle. A middle click-drag or moving the mouse wheel changes the zoom setting (z coordinate) of the camera.
2.3 Understanding the Error Info Field
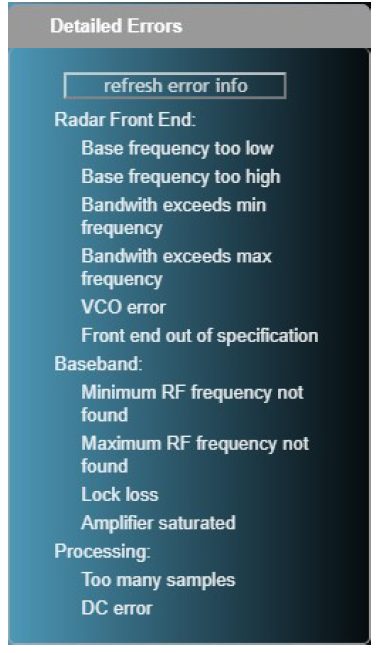
Temporary errors are indicated in yellow. Temporary errors are errors that are raised during processing but will be auto-corrected when the error disappears. The Detailed Errors Panel shows the full error explanation. You can retrieve the full error information by clicking the refresh error info button.

2.4 Understanding the Data View
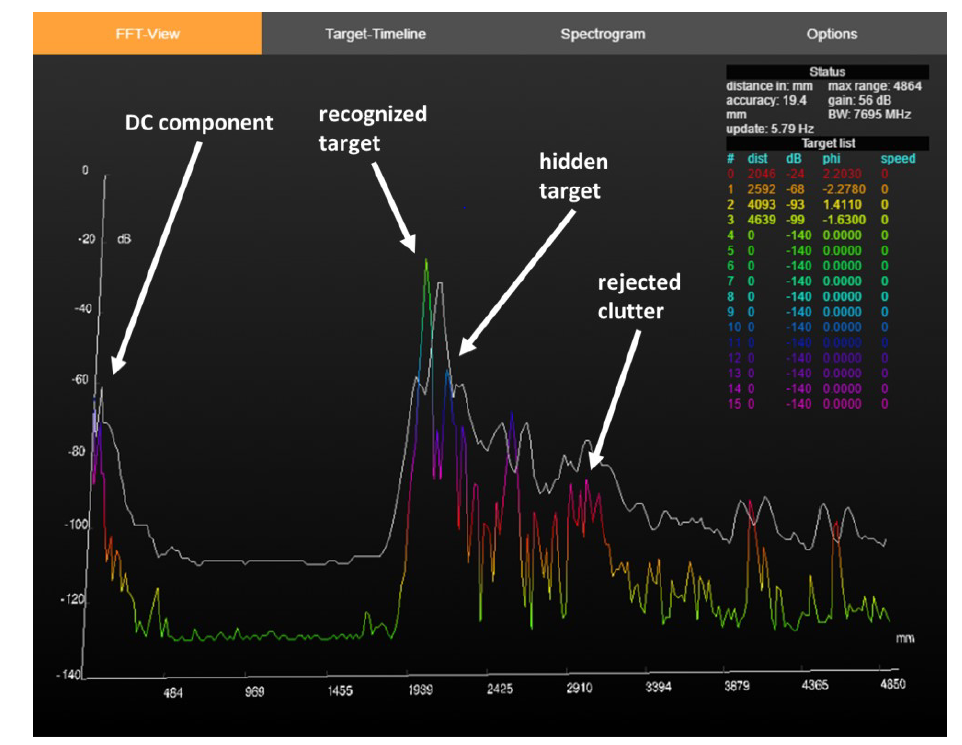
The figure shows a typical spectrum output of the SiRad Easy® when placed on a tabletop and looking to the ceiling. Viewing a radar target spectrum for the first time might be confusing for the beginner. However, with some practice, it is easy to find targets and understand why some things work while others might not.
Targets: The first ceiling echo is around 2 0 0 cm, which should be quite high versus the neighboring noise floor. Using a lens will make this target peak thinner and higher and more easily detectable by the CFAR operator. The next targets are around 260 cm, 410 cm, and 460 cm. Due to the adaptive nature of the CFAR operator, it might happen that if two targets are too near to each other or are very different in magnitude, one of them is rejected ( by the CFAR operator, such a target may be hidden around 220 cm. Changing the target recognition settings might help in this situation.
DC component: There is some DC component on the left side. If this DC offset is high, it might trigger a false target detection of the CFAR operator.
Clutter: Around 290 cm to 330 cm there might be some clutter that is rejected by the CFAR operator.
3 WebGUI 1.2.4
WebGUI 1.2.4 should be used together with the firmware 1.3.x or older of the Sirad Easy® and the SiRad Simple® evaluation kits. Please visit download area to download firmware, WebGUI, and protocol description.
Baudrate of 230400 should be selected from com2websocket.
4 WebGUI 1.4
WebGUI 1.4 should be used together with the firmware 1.4.x or newer of the Sirad Easy® and the SiRad Simple® evaluation kits. Please visit the download area to download firmware, WebGUI, and protocol description.
Baudrate of 1000000 should be selected from com2websocket.
5 WebGUI Easy r4
WebGUI 1.4 should be used together with the SiRad Easy r4 evolution kit. Please visit the download area to download firmware, WebGUI, and protocol description
Baudrate of 1000000 should be selected from com2websocket.


